
Logs
Events and inspection
Inspect diagnostic records and captured values attached to an operation.
Events shows the diagnostic records attached to an operation, including progress messages, exceptions and structured fields. Inspection presents supported input/output captures from those events as grouped values.
Read events
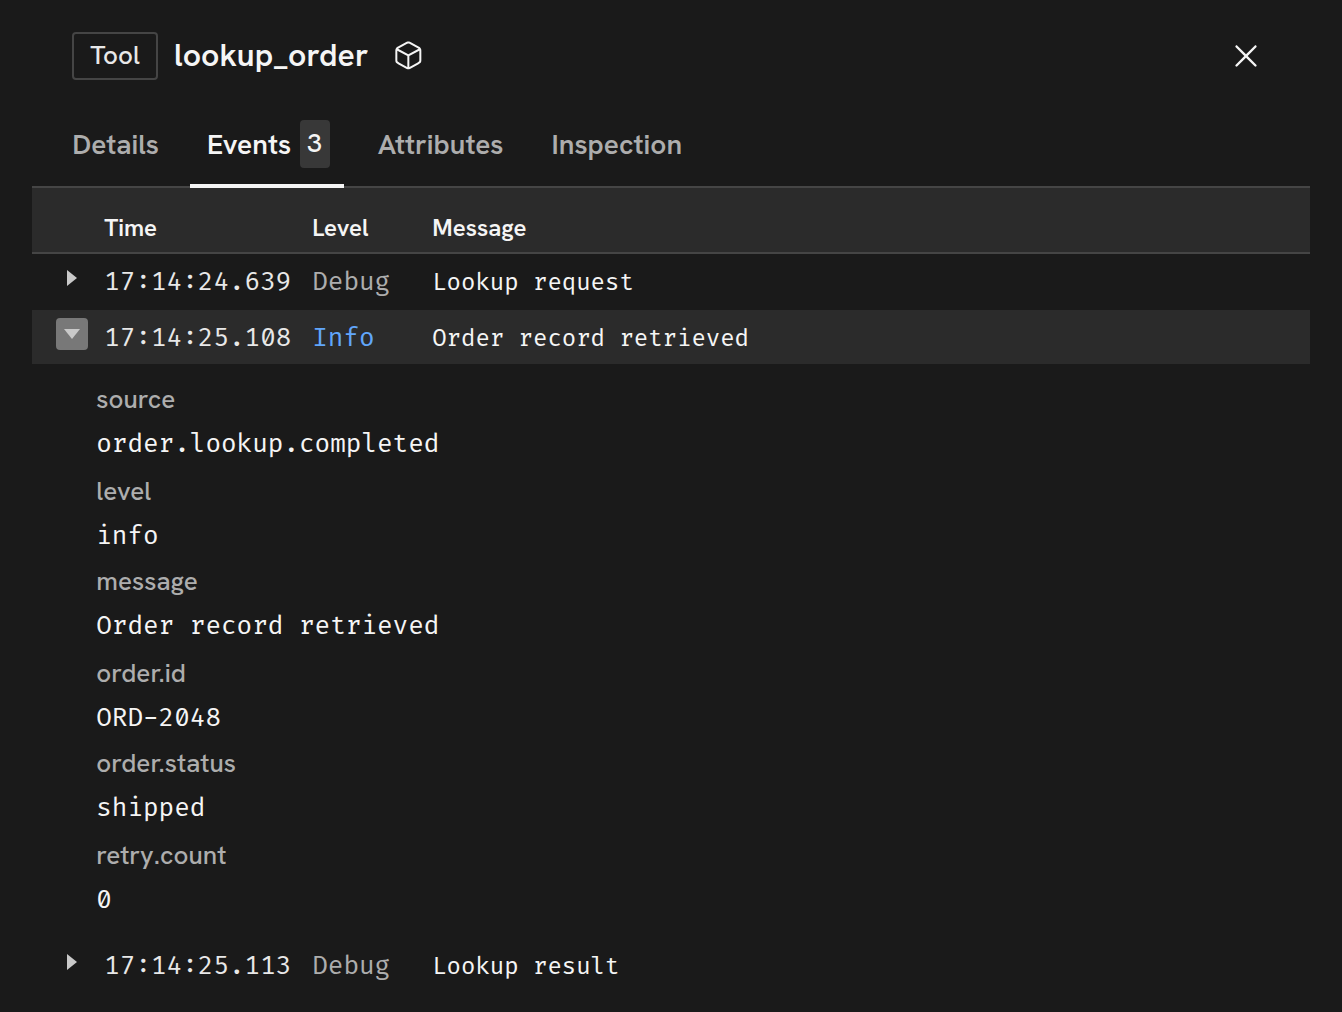
Section titled “Read events”Open an execution, select an operation, then choose Events in its record panel. The tab appears when that operation contains recorded events.
The list shows each event’s time, level and message. Expand an event to inspect its source name and structured fields. An exception can include its type, message and stack trace; an application event can carry progress or diagnostic values.
Inspect captured inputs and outputs
Section titled “Inspect captured inputs and outputs”When an operation contains captures from the Polaris inspection plugin or compatible instrumentation, its record panel also has an Inspection tab. It groups values recorded before execution under Inputs and values recorded after execution under Outputs.
Captures are grouped by parameter and include their recorded type metadata. The original events remain available in Events, so both views refer to the same captured data.
See the inspection event format for the fields used to emit these captures.
Copyright © 2026, Radiant AI Limited.