

Logs
Search and filters
Search and filter your application’s traces and agent runs.
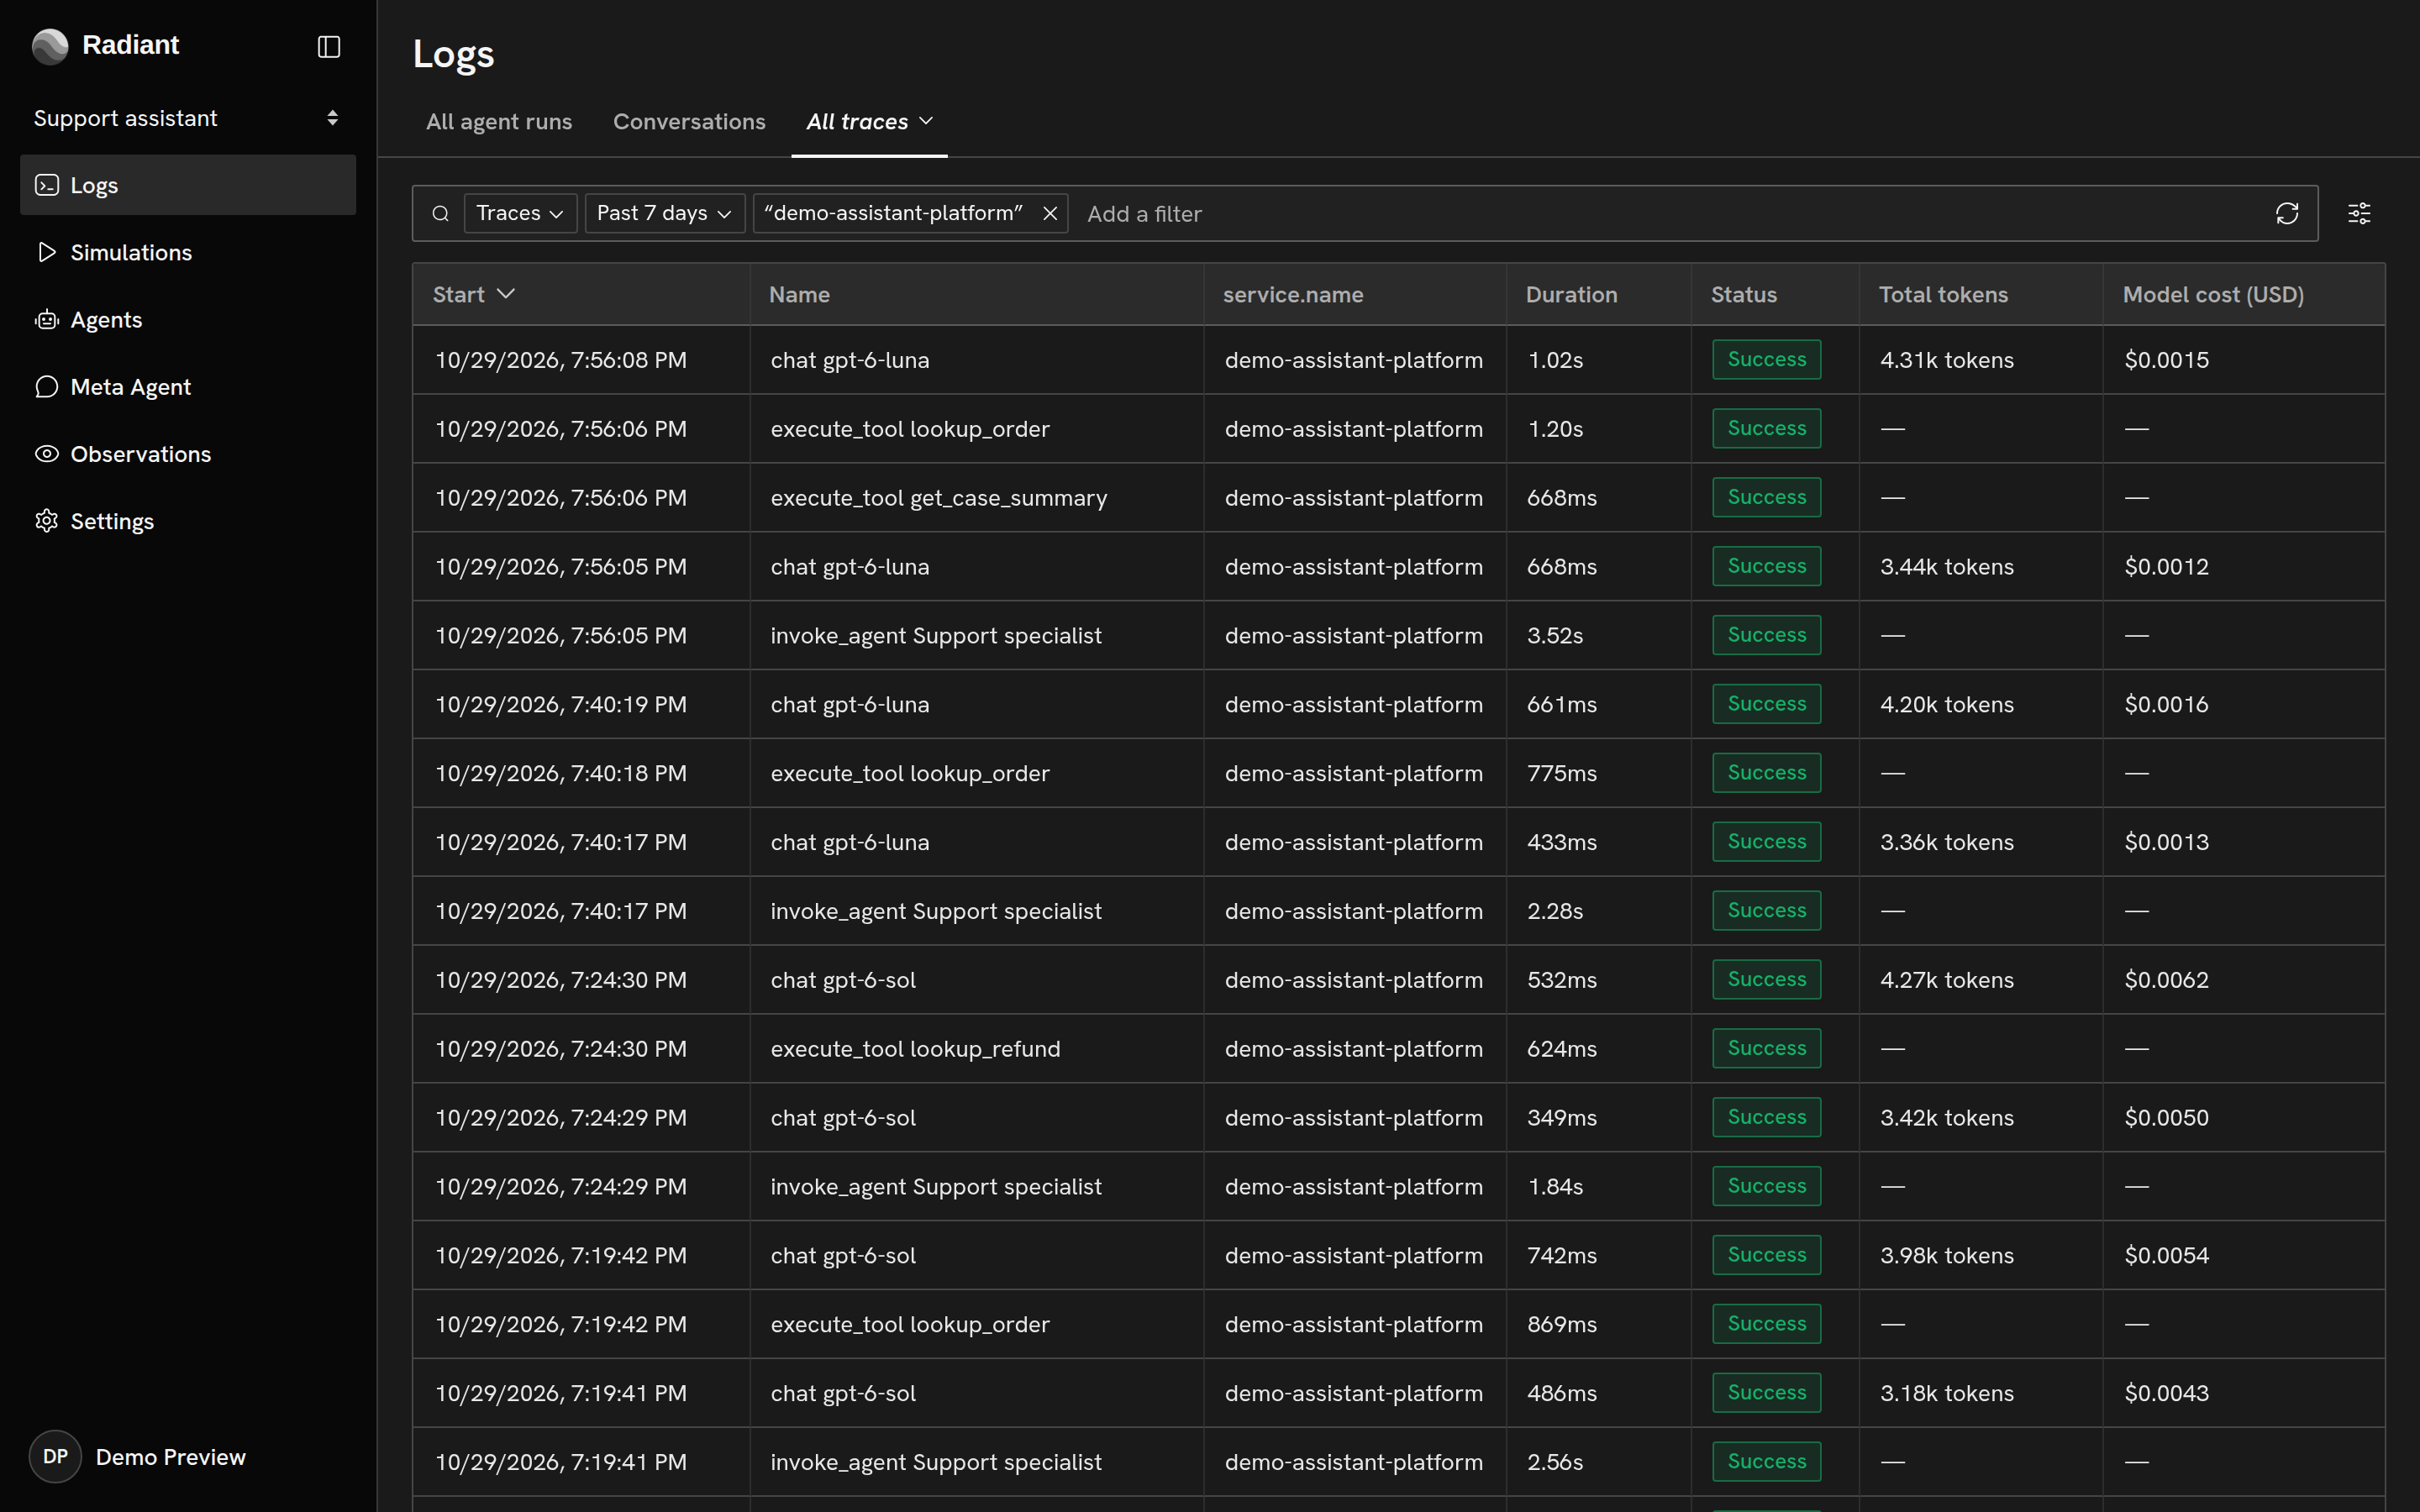
Logs lets you find and inspect recorded activity in the selected project. A view controls which activity is shown and how it is displayed. Views appear as tabs. Each project starts with All agent runs, Conversations and All traces; you can also create your own.
Logs opens on All agent runs, where each row represents one agent invocation. Use Conversations to follow related runs across turns, or All traces to search individual operations, including model requests and tool calls.
Conversations
Section titled “Conversations”A conversation brings together agent runs from related turns, including runs handled by different agents. Open Conversations to see those runs grouped together, then select a conversation to inspect its activity.
Runs belong to the same conversation when they share a gen_ai.conversation.id in the project. Your framework’s connection guide explains how to record it. Runs without this identifier remain available in All agent runs. The selected time range determines which part of a conversation is shown.
Search and filters
Section titled “Search and filters”The search bar combines an activity type, time range, text search and filters to control which results appear. Grouping brings related activity together within those results.
Activity type
Section titled “Activity type”The first selector controls the type of activity shown in the table:
- Traces shows all recorded operations.
- Agent runs shows only agent invocations, with a summary of each run. These runs are identified from the recorded traces.
Time range
Section titled “Time range”Use the time selector beside it to limit the results to a period. Choose a relative range, such as Past 1 hour, for recent activity, or Custom range for fixed dates. Live updates the results as new activity arrives.
Text search
Section titled “Text search”For text search, type into Add a filter and press Enter. Search matches literal text, ignoring case, across operation names, identifiers and recorded attribute values, including attributes not visible as columns.
Structured filters
Section titled “Structured filters”Filters narrow the results by status, duration or another recorded field.
Open Add a filter and choose Add structured filter. Select the field to filter and set the condition it must meet. Once added, the filter appears in the search bar, where you can edit or remove it.
Field and value suggestions come from your project’s activity. You can enter a custom attribute key directly if it is not listed.
Grouping
Section titled “Grouping”Grouping brings records with a shared attribute into one result. Use it when a conversation or workflow spans several requests and you want to inspect that activity together.
Open the Traces or Agent runs selector and choose Group by. Select an application attribute, or Trace ID to group one distributed execution. Conversations uses this same grouping mechanism with agent runs and gen_ai.conversation.id.
The selected time range bounds each group’s activity. When grouping by an attribute, records belong to the same group only if the attribute values and their types match. For example, customer.id set to the text "104" forms a different group from customer.id set to the number 104.
Open a group to inspect its related activity, or use Trajectory View to follow the connections between operations. Filters determine which groups appear. Opening a group shows all its related activity, including operations that didn’t match the filters.
Columns
Section titled “Columns”Use Columns under View options to show or hide columns. You can also change their order and width.
Sorting
Section titled “Sorting”Select a column heading to sort the results.
Copyright © 2026, Radiant AI Limited.